Claude, for which segments do we offer visualizations?
Our solutions are flexible and can be adapted to the specific needs of each segment.
We offer our visualization solutions with GridVis for various segments to meet specific requirements in different areas:
- Energy suppliers: our dashboards help energy suppliers to precisely monitor energy flow, grid stability and consumption. By visualizing load peaks, faults and other relevant parameters, they can improve grid quality and increase efficiency.
- Industry and commerce: In this segment, we support companies in optimizing their energy consumption and reducing costs. Detailed visualizations allow production processes to be better monitored and potential energy savings to be identified.
- Administrations: For public institutions and administrations, our visualizations provide a transparent overview of energy consumption in buildings and facilities. This makes administration easier and helps to achieve sustainability targets by identifying and improving inefficient energy use.
What are the possibilities?
Our visualization solutions with GridVis offer a wide range of options for displaying energy data clearly and in detail:
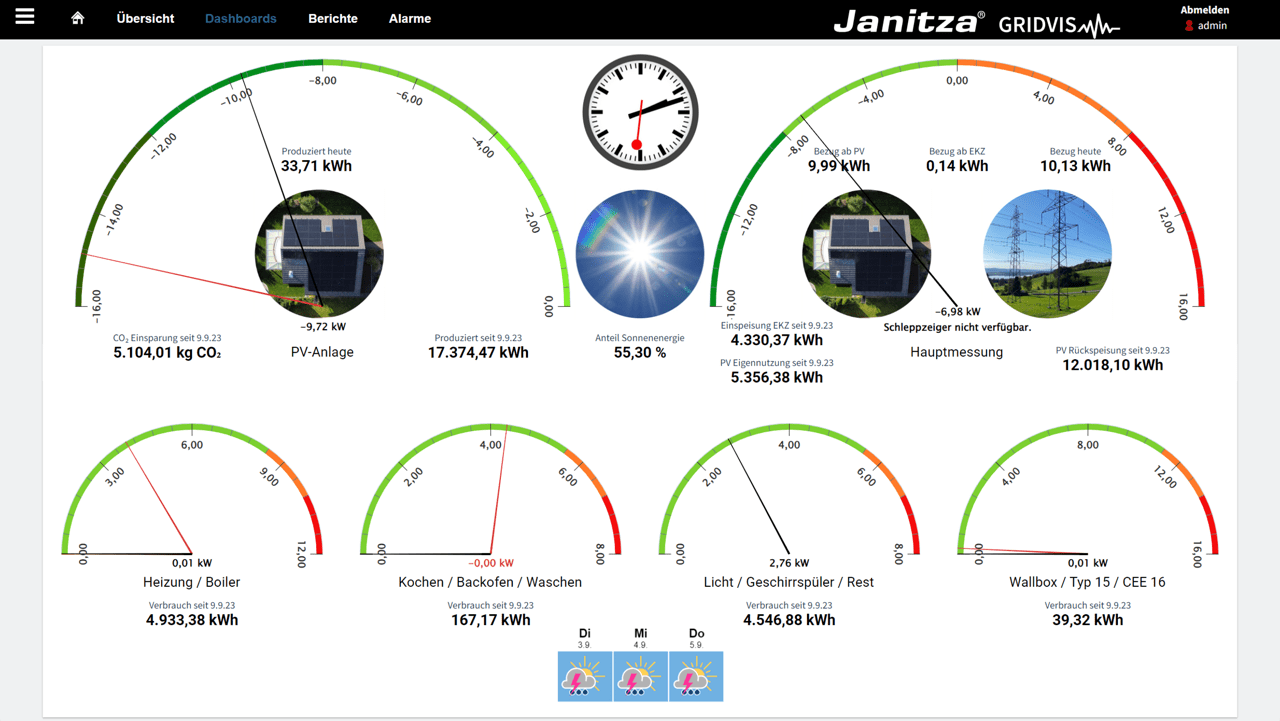
- Overview page with energy values: A central overview that shows all important energy data in real time, such as consumption, load peaks and voltage quality.
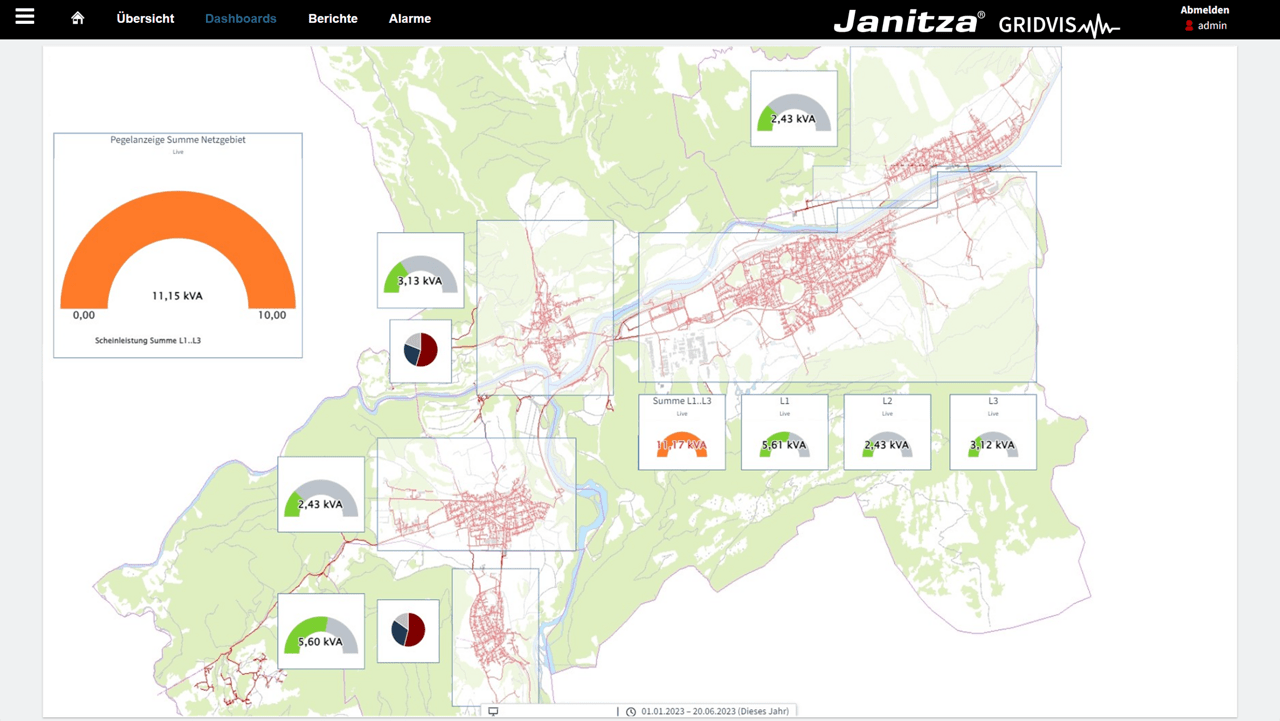
Overview of the supply area: Display of the entire supply area for monitoring energy flows and grid loads.
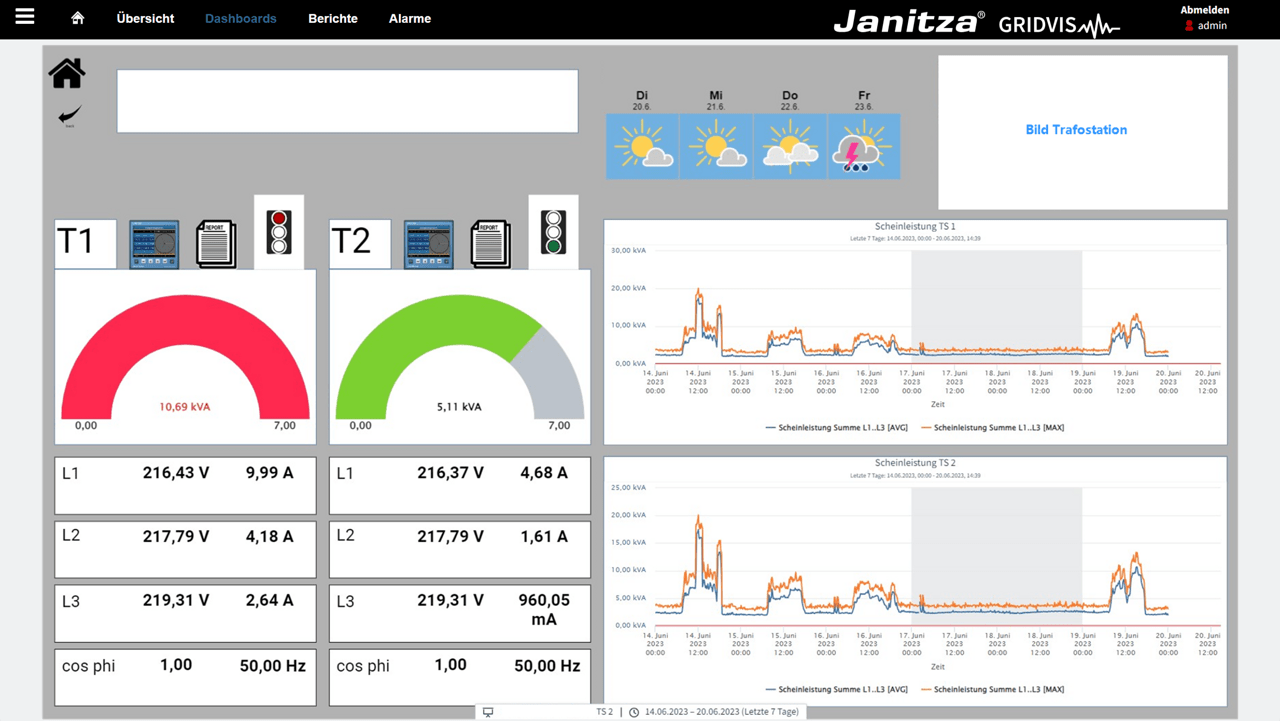
Detailed measured values of a transformer station: In-depth insights into specific measured values such as voltage and current for a transformer station in order to analyze its performance.
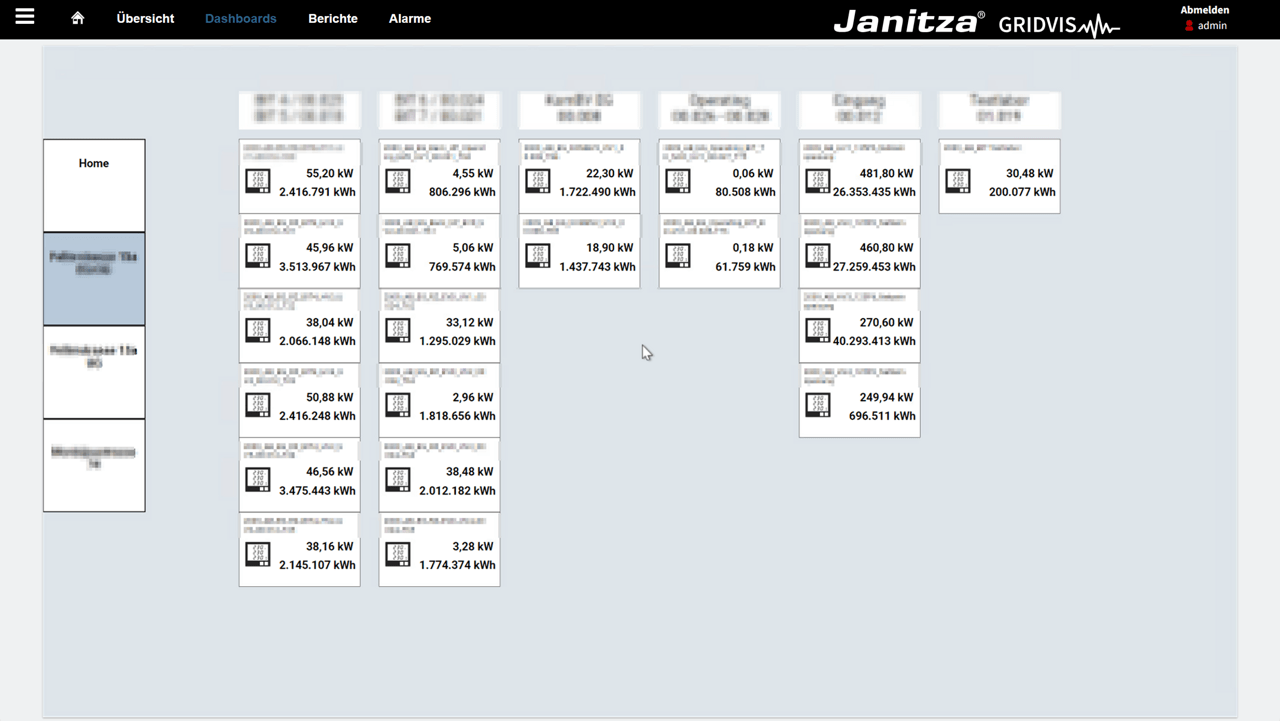
Current power values of all outgoing feeders of a main distribution board: Real-time monitoring of the power values of all outgoing feeders of a main distribution board to optimize and avoid overloads.
What are the requirements?
GridVis Expert or GridVis Standard: One of the GridVis software versions is required to make full use of the visualization functions. Either Expert or Standard. These offer the necessary tools and functions to evaluate detailed energy data and create dashboards.
Janitza UMGs: Janitza UMG measurement devices are required for data acquisition and monitoring. These devices record the necessary energy and performance data, which can be visualized in GridVis. The Janitza UMGs are specially designed for precise measurement and monitoring in different application areas, which makes them an essential part of the system.


